

Overview
1 An Introduction to Data Sources in Ingenuity 7
Section titled “1 An Introduction to Data Sources in Ingenuity 7”Ingenuity is Eigen’s digital platform for Engineering and Industrial Operations. It is built by Engineers, for Engineering and Asset Managers to make working with data a joy. The Ingenuity platform was first written in 2009 and now, 15 years on, Ingenuity 7 is a major new release; a complete re-write from the ground up to include the latest and best technology and incorporate all the learnings we have from over 17 years deploying digital capability for Oil & Gas, Energy, Chemicals and Manufacturing industries. It’s faster, more secure and more intuitive than ever before.
There is a publicly accessible demo of Ingenuity 7 available at https://ingenuity-sandbox.eigen.co/.
1.1 What is Ingenuity?
Section titled “1.1 What is Ingenuity?”Eigen Ingenuity is a digital platform for getting value from data, improving decision making and automating labour intensive work processes.
It is a layer on top of existing systems and makes it easy way to combine, visualise, publicise and share information from existing systems through online charts, dashboards, reports and automate workflows.
There is no requirement to copy data to a data lake or replace the underlying systems. It is also agnostic, so it is easy to roll out capability across sites with different systems.
1.2 What is a Data Source?
Section titled “1.2 What is a Data Source?”Ingenuity data sources provide the information displayed in charts, dashboards, tables, and other visual elements.
Ingenuity comes with a number of data source templates that can be installed and configured locally. It is also possible to add a custom data source (see section 3).
1.3 Types of Data Source
Section titled “1.3 Types of Data Source”There are 3 types of data source:
-
Web API
-
Driver based
-
Timeseries Historian
Web API data sources
Section titled “Web API data sources”Web API data sources are the simplest to set up and can be configured directly via the Ingenuity Hub. They can connect to any Web API data source and allow the inputs and results to be exposed to the UI so that a user can interact with it. See Appendix 1 for an example.
Driver based data sources
Section titled “Driver based data sources”Driver-based data sources connect directly to external systems like SQL Server, SAP, and Oracle that need special software to access them. These systems typically use their own connection methods rather than web-based ones, and have specific security requirements such as ODBC connections. The drivers handle the technical details needed to work with each unique data system and often provide more features than a web API would. To use these sources with Eigen Ingenuity, you must first install and set up a driver, then configure the connection through Ingenuity Hub.
Timeseries Historian data sources
Section titled “Timeseries Historian data sources”Timeseries Historian data sources are a special case of a Driver based data source and are required to connect to a data source that provides timeseries data, such as Aveva PI, Aspentech IP.21, InfluxDB etc. Data in an SQL database can also be exposed as timeseries data using the Eigen SQL Historian driver. A timeseries data source is required by the Calculation module. Further details on the Timeseries Historian data source are given in section 1.4 below.
1.4 Timeseries Historians — a special type of data source
Section titled “1.4 Timeseries Historians — a special type of data source”Timeseries Historian data sources support the full range of functionality available in a true data historian. This means:
-
Raw and interpolated data
-
Aggregate functions
-
Optimised retrieval of time-ordered data
The Eigen Calculation Historian is itself a Timeseries Historian data source within Ingenuity and can only perform calculations on other timeseries historian data sources.
1.4.1 The Historian Multi data sources
Section titled “1.4.1 The Historian Multi data sources”All timeseries historians are presented to the user through the “Historian Multi” data source and data within them is addressed with the following syntax:
Historian_Instance/tagNameFor example:
Ip21/21PST12345.valueonshore-pi/ONS_13FIT4321.Xcalc/ADD(1,3)eventlog/DailyVolume?field = brentThere is a separate instance of the Historian Multi data source for Values and Charts:
- Historian Multi Value
- Historian Multi Chart
These data sources are built-in to Ingenuity and should not be edited or renamed.
1.4.2 Timeseries historian data source architecture
Section titled “1.4.2 Timeseries historian data source architecture”The Historian Instance is configured in the Ingenuity back end and requires the Eigen driver for the underlying data historian. This Historian Instance is then registered in the Historian Web API server. The Historian Multi data sources in the UI connects to the Historian Web API and makes the data from the Historian Instances available.
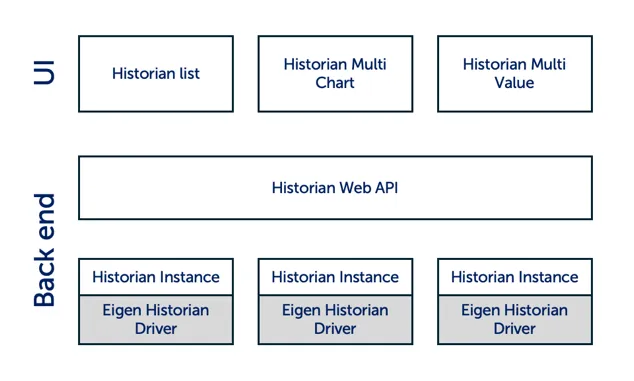
The Eigen Historian Drivers are separately licenced components that enable seamless integration of the different data historians. They are available for:
- Aspentech IP.21
- Aveva PI
- Cognite CDF
- InfluxDB
- SQL databases
1.5 Data source compatibility
Section titled “1.5 Data source compatibility”Data sources must output data in specific ways in order to be compatible with charts, tables, values and other components. The components they support must be declared in the “compatibleWith” section in the data source configuration.
"compatibleWith": [ "chart" ]The list of possible entries is:
-
Value: returns a single value at the requested time. Can be used by dashboard components that display a value at a point in time.
-
Multivalue: returns a set of values at the requested time. Can be used by dashboard components that display a value at a point in time.
-
Table: returns a dataset with column headings and rows. Can be used to drive a DataTable component in a dashboard.
-
Chart: returns one or more datasets with “x” and “y” values that can drive a chart or sparkline component. The time is always the “x” value and the “y” values can have any name.
-
Sunburst: returns a dataset that supports the Sunburst component
-
Map: returns a dataset compatible with the map component
1.6 Data Source Datasets
Section titled “1.6 Data Source Datasets”The type of dataset that a data source returns is defined in the “compatibleWith”: [ ] section. The options are:
- Chart
- Value
- Multivalue
- Table
- Sunburst
- Map
1.6.1 Chart
Section titled “1.6.1 Chart”Chart data sources provide a timeseries ordered list with an ‘x’ output as a minimum, and one or more fields that can be plotted as the “y”. The ‘x’ output must be called ‘x’.
"output": { "paths": [ { "name": "y" }, { "name": "x" } ],The inputs must include a start and an end timestamp with the isAdvanced and isChartStart/isChartEnd set to True so that the start and end time are passed directly from the chart (or page) controls (see section 3.2.2 for details on what these options do).
"inputs": [ { "name": "start", "type": "body", "isAdvanced": true, "isChartStart": true }, { "name": "end", "type": "body", "isAdvanced": true, "isChartEnd": true }]1.6.2 Value
Section titled “1.6.2 Value”Data sources that provide a single value output are the simplest type. There is no requirements to have any inputs. If a time input is specified, it can be set by the page by adding the “isChartEnd”: true property to the relevant input
1.6.3 Multivalue
Section titled “1.6.3 Multivalue”The Multivalue data source is similar to the Value data source but has more than one Output.
1.6.3 Table
Section titled “1.6.3 Table”A data source that is compatible with a Table must provide one or more fields with rows of data. For example:
"output": { "paths": [ { "name": "title", "path": "$.features.*.properties.title" } ]}1.6.5 Sunburst
Section titled “1.6.5 Sunburst”The Sunburst data source type must provide a nested json tree structure that is compatible with the D3.js Sunburst component.
See https://observablehq.com/@d3/sunburst/2 for more details.
1.6.6 Map
Section titled “1.6.6 Map”The Map data source type must provide a GeoJSON compatible response. See https://geojson.org/ for more info.
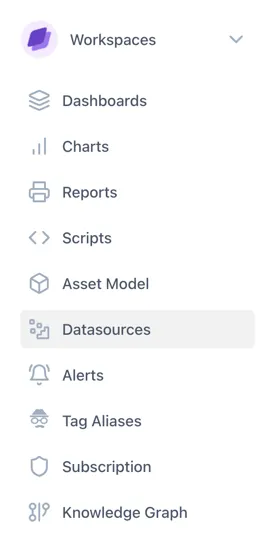
1.7 Viewing available data sources
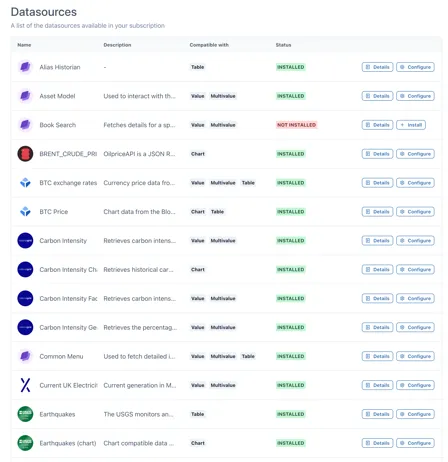
Section titled “1.7 Viewing available data sources”The list of available data sources can be accessed from the “Data sources” module in the left hand navigation panel:
This will bring up the list of available data sources and whether they are installed or not. It also shows the types of component that can use that data source (value, multivalue, table & chart.
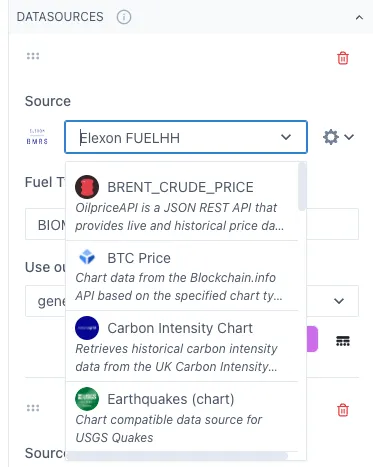
1.7.1 Data sources in a Chart
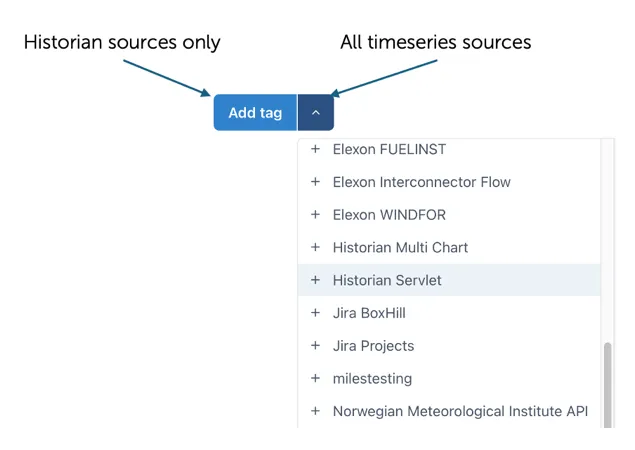
Section titled “1.7.1 Data sources in a Chart”Clicking on the “Add tag” button in a Chart will automatically bring up the search form for Historian Timeseries data sources. The dropdown menu on the right of the button will list all compatible Timeseries data sources.
1.8 Installing a data source
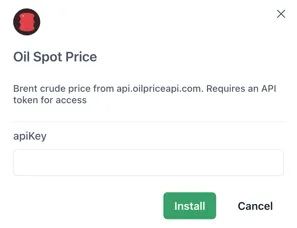
Section titled “1.8 Installing a data source”Data sources are installed (from Data source Templates) via the Data sources module by clicking on the “Install” button at the right hand side.

This will then bring up details of the data source with an input field for any parameters required, for example an Api key. Enter the required information and click on “Install” to install the data source
2 Comparison Table of Data Source Types
Section titled “2 Comparison Table of Data Source Types”This section summarises the differences between a Timeseries Historian data source and other data sources.
| Timeseries Historian | Driver Based (e.g SQL) | Web Api | |
| Charts | ✅ | ✅ | ✅ |
| Values | ✅ | ✅ | ✅ |
| Tables | ✅ | ✅ | ✅ |
| Use in calculations | ✅ | - | - |
| Interpolated data | ✅ | - | - |
| Requires driver | ✅ | ✅ | - |
| Search tags | ✅ | - | - |
| Data Source name | Historian Multi | any | any |