Title Bar
2.6 Title bar
Section titled “2.6 Title bar”
2.6.1 Setting the Chart Time Range
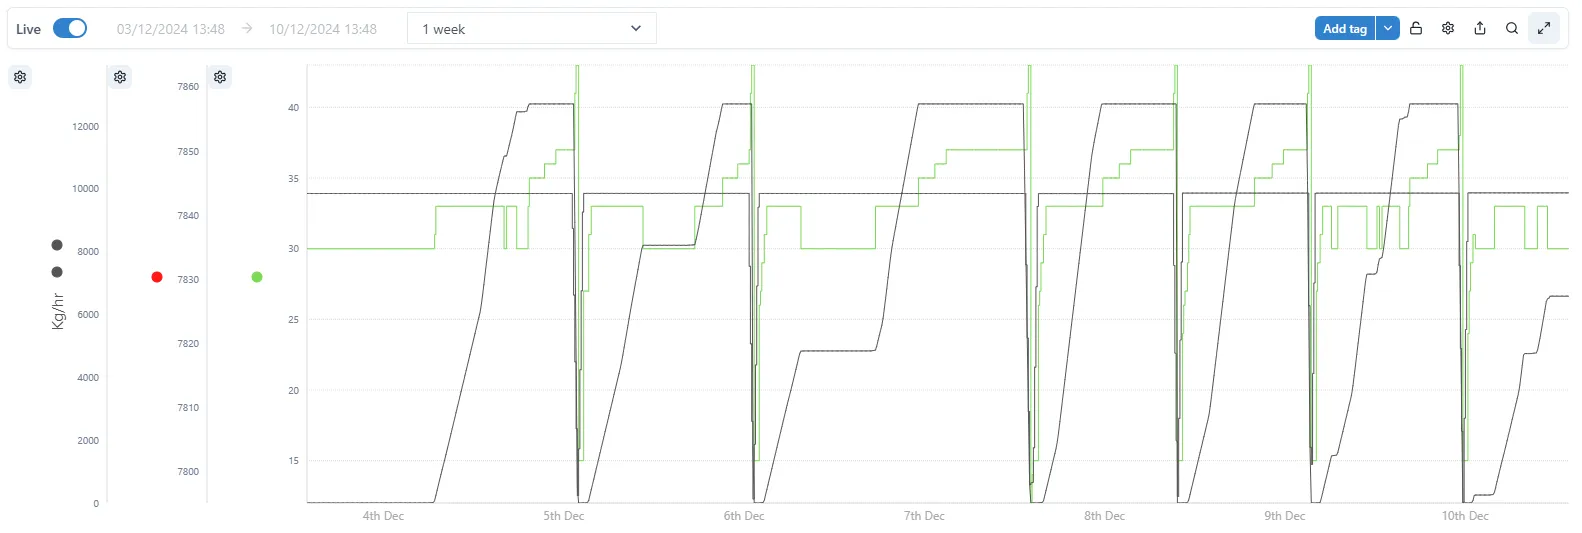
Section titled “2.6.1 Setting the Chart Time Range”Above the chart are the controls to set the chart’s time range.
![]()
There are two modes: Live and not Live.
In Live mode, the chart end date/time is the current time. The start date/time is determined by choosing a duration from the dropdown. There are some pre-configured durations, or it is possible to create a custom duration.
In non-live mode, simply set the desired start and end times, and click the Go button. In this mode, the end date does not update in real-time, unlike in Live mode.
2.6.2 Padlock
Section titled “2.6.2 Padlock”Use the padlock to lock the chart format and prevent accidental changes.
![]()
![]()
2.6.3 Settings
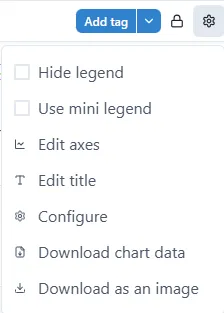
Section titled “2.6.3 Settings”See section 2.7, below.
2.6.4 Share
Section titled “2.6.4 Share”This creates a copy of the chart and provides the opportunity to save and share the URL of the copy with other users.
![]()
2.6.5 Examine
Section titled “2.6.5 Examine”Opens a copy of the chart in a pop-up. Any changes made to the chart can be saved to the original.
![]()
2.6.6 Seamless mode
Section titled “2.6.6 Seamless mode”Switch to Seamless mode. Charts in Seamless mode don’t show the title bar. This is useful for dashboards and reports where a clean, uncluttered look is required. There are further options for adjusting how a chart is displayed in the “Settings” menus — see section 2.7.
To switch between Seamless and normal mode click the icon
![]()
Seamless mode
Section titled “Seamless mode”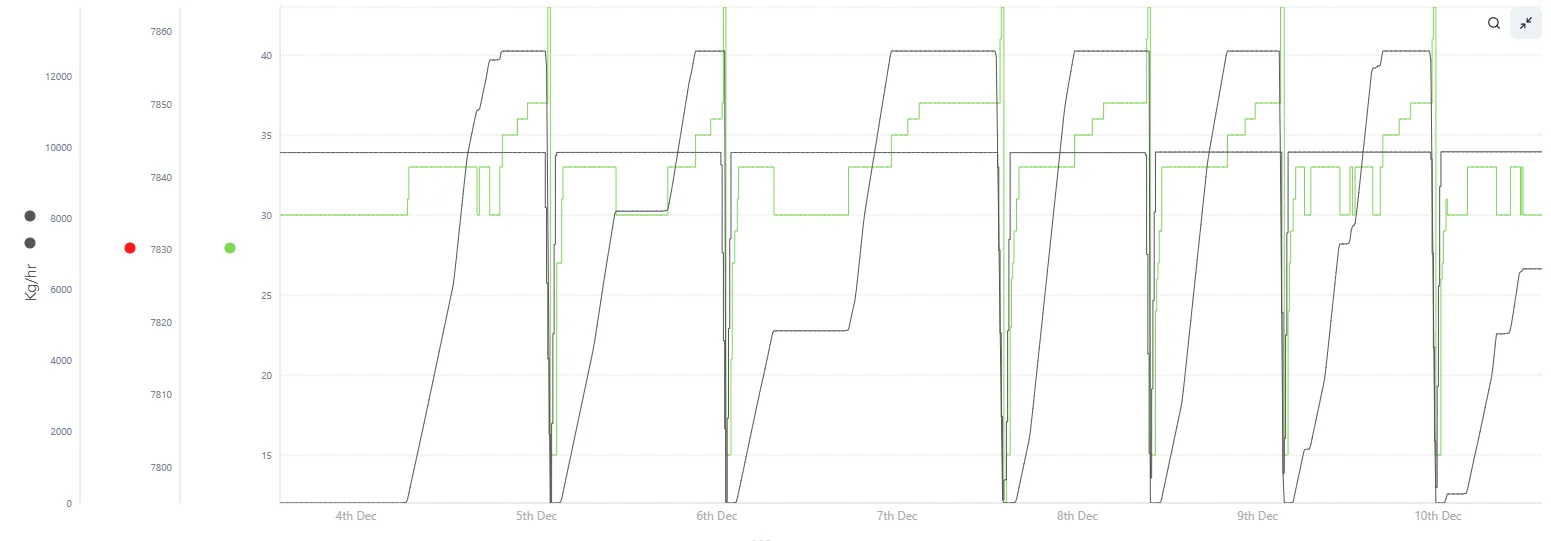
Normal mode
Section titled “Normal mode”