Working with Calculations
4 Working with Calculations
Section titled “4 Working with Calculations”This chapter covers detailed aspects of working with calculations to make more intuitive and user friendly content.
4.1 SLIDINGAGG vs WINDOWAGG
Section titled “4.1 SLIDINGAGG vs WINDOWAGG”Both SLIDINGAGG and WINDOWAGG are types of aggregate calculations that can be performed on time series data and are used to compute aggregate functions like min, max, average, etc. There are important differences between them though, and these are described below.
4.1.1 Differences
Section titled “4.1.1 Differences”Data Source for Calculation:
Section titled “Data Source for Calculation:”SLIDINGAGG calculations are performed over interpolated points retrieved from the historian . The system retrieves a range of points and then calculates the aggregate over a sliding window.
WINDOWAGG calculations, in contrast, request the aggregated data directly from the historian . If the underlying historian does not support direct aggregate retrieval for the specified window, the Eigen historian driver will simulate it by fetching raw data and performing the aggregation .
Window Behavior:
Section titled “Window Behavior:”SLIDINGAGG operates with windows that slide over time1 … For each point in time, the aggregate is calculated based on the data within the preceding (or centered) time window that moves with the current time.
WINDOWAGG uses fixed windows that are aligned to specific time boundaries, anchored to the nearest midnight UTC. The aggregate is calculated for these discrete, non-overlapping time intervals .
Real-time vs. Retrospective Analysis:
Section titled “Real-time vs. Retrospective Analysis:”SLIDINGAGG provides a consistent view of the aggregated data in both real-time and when looking back at historical data because the calculation is always based on a defined sliding window of past data.
WINDOWAGG can exhibit different behavior in real-time for the current, incomplete, window compared to its retrospective view once the window has fully elapsed. Until the end of the window, the aggregate value (like maximum for a totalizer) will not reflect the full range of data within that window. Therefore, WINDOWAGG is considered more of a retrospective function12 .
Performance:
Section titled “Performance:”WINDOWAGG is generally more performant than SLIDINGAGG when the historian natively supports aggregate queries, as it reduces the amount of data that needs to be transferred and computed.
Handling of Peaks:
Section titled “Handling of Peaks:”In SLIDINGAGG, a peak value within the sliding window will influence the aggregate output for the entire duration the peak remains within that window (i.e. from the timestamp of the peak to the timestamp + window).
In WINDOWAGG, a transient peak occurring late in a window might only affect the aggregate calculation for that window briefly in real-time. However, when viewed retrospectively, that peak will be reflected in the aggregate for the entire window. For example, a peak occurring in the 59th minute of a 1 hour window for a MAX calculation will affect the current value for 1 minute but then the whole prior window will take on that value as soon as the window period rolls over to a new one.
Use Cases:
Section titled “Use Cases:”SLIDINGAGG is suitable for applications where a continuously updating aggregate value based on a recent time window is required, such as dashboards showing real-time trends.
WINDOWAGG is well-suited for analyzing data over completed, fixed time intervals, like calculating daily, monthly, or yearly averages, or for visualizing the range (min/max) of values within those fixed periods.
4.2 Calculation example: Totalise for quarterly rates.
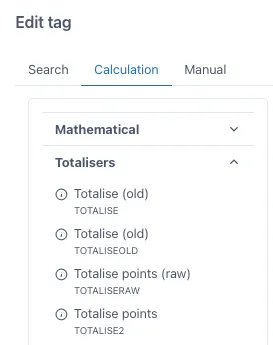
Section titled “4.2 Calculation example: Totalise for quarterly rates.”In this calculation example we will cover a very popular function from our calculation engine which is Totalise points. For calculating daily rates from a tag with hourly rates, for example, m3/h of production, we have to use the Totalise points function. Drag this function into the grid from the menu in the “Calculation” tab when adding a tag, you will find it under the “Totalisers” tab.
The input to this function will look as follows.
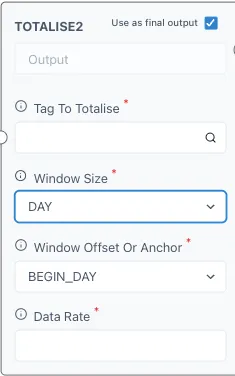
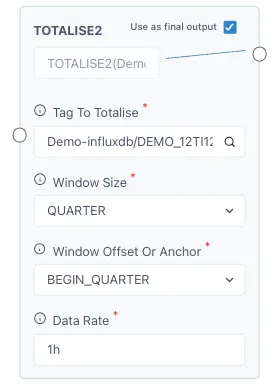
Under “Tag to Totalise” you will add the tag or calculation you wish to totalise. You can click on the magnifying glass to search for a tag if necessary. The tag should have the name of the historian followed by a ”/” before the name of the tag, if you search for it with the magnifying glass there is no need for this. Take note of the units of the tag since we will need this information later.
The “Window size” refers to the time span that you wish to totalise your tag to, for example, we have our production tag in m3/h and we wish to know how much we produce per quarter, then the “Window size” should be “Quarter”. Click on it to open the drop-down menu and select the desired option.
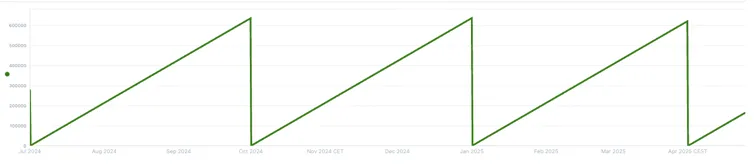
For “Window Offset or Anchor” we will select “BEGIN_QUARTER”, this means that it will start from 0 each quarter (1st January, 1st April, 1st July and 1st October). And lastly, we will add the “Data Rate” from our tag, since this example has a tag with m3/h, the data rate will be “1h” for 1 hour. For 1 second the value would be “1s”, for daily rates it would be “1d”, etc. Here is the input from our example and how it looks on a chart.