Process Graphics
4 Live Graphics
Section titled “4 Live Graphics”Ingenuity 7 includes a powerful new module to enable the creation of detailed graphics such as control system mimics, live process flow diagrams, network overviews, equipment dashboards etc. In addition to adding all the widgets for a dashboard, it is now possible to access graphics from stencil libraries, add data and animations and connect them together with lines.
Unlike traditional graphics packages, Eigen Ingenuity 7 users can combine data from multiple different sources in one graphic.
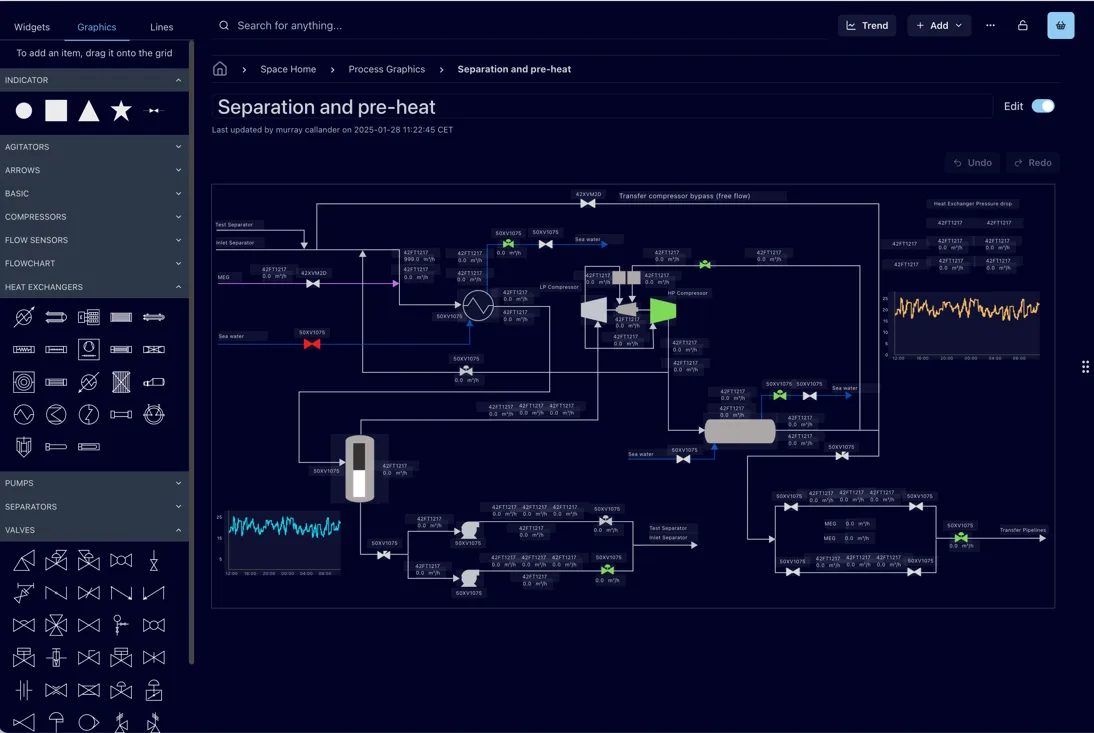 An example of a live graphic in “Edit” mode showing some of the available shapes.
4.1 Creating Graphics
Section titled “4.1 Creating Graphics”Graphics are Dashboards so the starting point is the same - create a Dashboard or a Dashboard (Scaled). Graphics can be used in both types of dashboards, but it is recommended to use the Dashboard (Scaled) to have more freedom of positioning your graphic indicators and have the dashboard scale itself to the window size.
To open the graphics menu in Ingenuity 7, open a dashboard or page in edit mode and select the Graphics option in the left side menu.
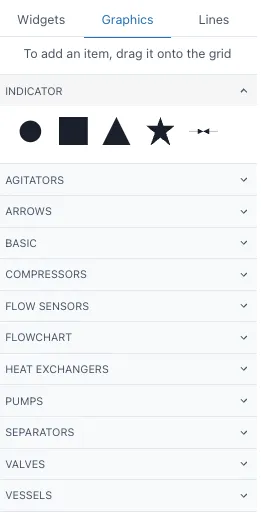
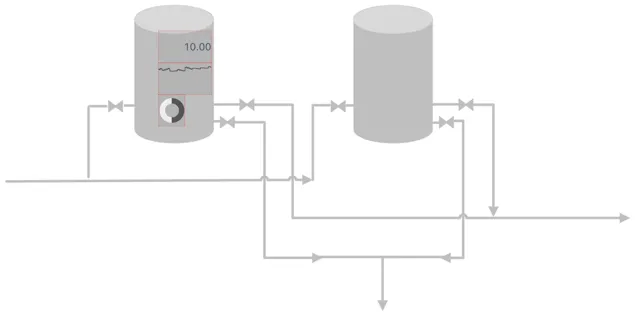
Under each section of the menu, you will find a varied selection of items you can drag of the grid to start mapping your system. These graphics work as an indicator from the widget menu so you can link them to a fixed value, tag or calculation and add static or data source criteria to denote their state. You can find more information on indicators in 3.1.11 of this manual. You can add and overlay widget items on the grid to further complement your system map as the image below, remember deactivating the toggle for Prevent collision under the Grid settings.
To make it easier to replicate complex elements such as the previously shown., it is recommended to add the items into a group widget and the copy this widget or selecting all the items to copy while on Edit mode and use Ctrl + C. To connect the different graphics, open the Lines menu on the left side. This will open different options of lines to add to your system.
4.2 Lines
Section titled “4.2 Lines”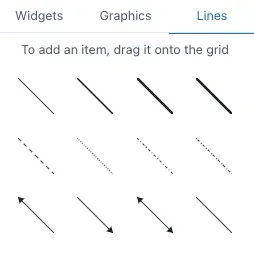
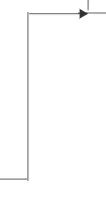
Drag and drop the lines from this menu or draw the line with your cursor in the grid, if you hold Shift you can create corners in your lines as the image below
. 
You can also change the type of line once you have in the grid by selecting the line you wish to change and click on the option in the left side menu you wish to change to. You can change the color and further modify your lines on the right-side menu
4.3 Understanding Layers and Object Orders
Section titled “4.3 Understanding Layers and Object Orders”It is important to understand that there are 3 layers in any dashboard:
-
Top
-
Middle
-
Bottom
The top layer is composed by the widgets and graphics of the dashboard. The middle layer includes the lines, and the bottom layer is the background of the dashboard. It is possible to select objects from the top and middle layers simultaneously in edit mode as shown below. When they are selected you can move, copy or delete them all simultaneously, similar as if they were in a group widget.
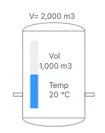
However, objects in the bottom layer are not available for selection, for example, images set as background in the grid settings. They will remain in the background in their fixed position, and you would only select the widgets, graphics or lines that are on top of them. In this example, the image is set as background in the grid settings, therefore when we select and drag the mouse to “select” the tank on the left area, we will only be selecting the widgets, lines and graphs on top of it, not the tank itself.
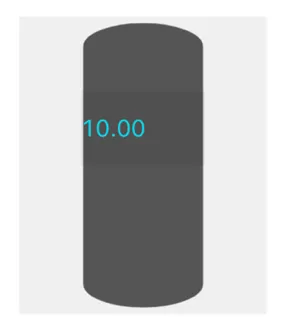
When we are overlaying different elements in a dashboard, the smaller objects will always be on top of the larger objects so they can be seen and selected. For example, if I add a filled graphic of a tank and drag it towards a number widget that is smaller than the tank itself, the number will remain on top once you click anywhere on the dashboard. This works regardless of the order in which you added the elements.