

Frequently Asked Questions
7.1 How do I add a background Image
Section titled “7.1 How do I add a background Image”There are two ways to add a background image in a dashboard and each option caters to a different need.
Fixed background image
Section titled “Fixed background image”If you want to add fixed background image that will cover the whole dashboard, you can open your dashboard in edit mode, select Grid settings on the right-side menu and then Background. Upload and crop the background image as desired and then select save. This image will be on the bottom layer of the dashboard, therefore, all other widgets or graphics implemented to it will be on top of the image. This option is ideal if you wish to set a common background for your pages based on the company colors.
Next, we have an example of this setting in main view and edit mode. A regular dashboard (not scaled) was used for this example, which is the recommended dashboard for this type of background-fixed scenarios. For more information on this, see section 2.2.2.
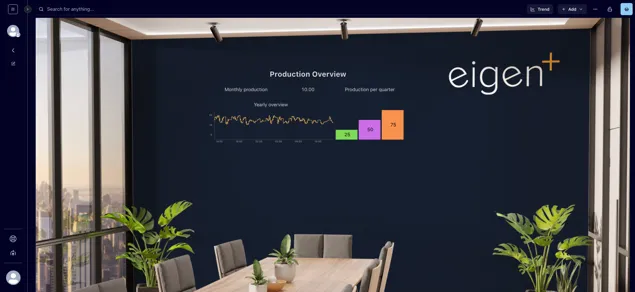
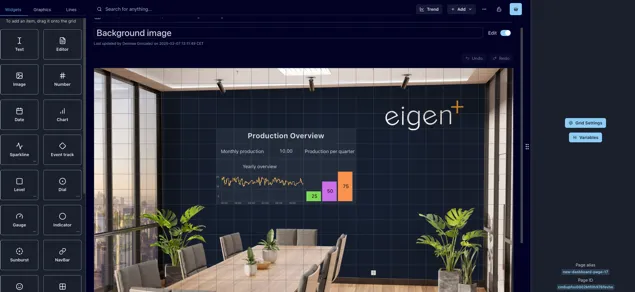
Image Widget
Section titled “Image Widget”If you wish to insert an image in your dashboard that will not be set as background, it is recommended to add an image widget (see section 3.1.3). This will allow you to move the image as desired as well as changing its size. If you wish to overlay this image with other elements, remember to check you have the Prevent collision toggle off in the Grid settings (see section 2.2.1).
7.2 How do I select multiple objects
Section titled “7.2 How do I select multiple objects”To select a single object, place the mouse pointer over the object and click on it. To select multiple objects, you can either:
-
Hold down the [Shift] key while selecting the individual objects
-
Click and drag the mouse pointer over the objects. In this case every object that is touched by the rectangle will be selected
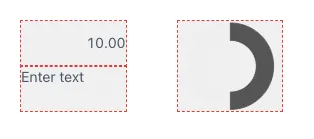
You can identify all the selected objects by the red line surrounding the item. Once you have selected multiple objects you can move them all by dragging them across the dashboard, copy them or deleting them.
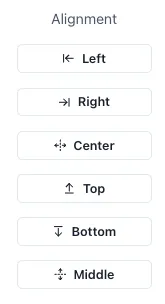
You will also see some options on the left-side menu to align the selected items vertically or horizontally.
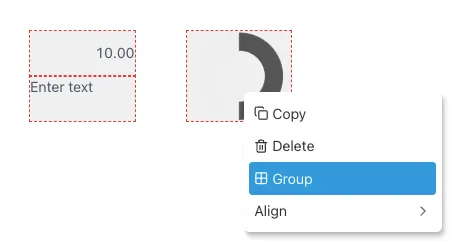
7.3 How do I group objects
Section titled “7.3 How do I group objects”Either select them and right-click and select “Group” or add a group object and drag the components into it.
7.4 How do I remove objects from a group
Section titled “7.4 How do I remove objects from a group”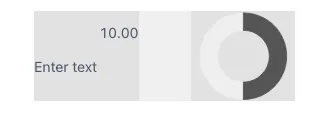
To remove an object from a group but keep it in the dashboard, drag the item outside the group element and place in the desired position.
If you wish to delete an object in a group, select the specific object to erase and click the Delete or Backspace button. Make sure you have selected the item and not the whole group, if you selected the whole group and click delete this will remove all the group and widgets in it. Remember you have the Undo and Redo buttons in case you are not happy with the changes. Pressing Ctrl + Z also works to Undo your latest changes.
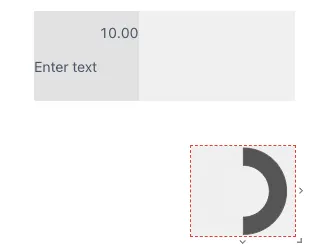
7.5 Why can I not select a group to move it?
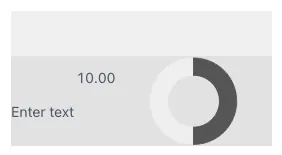
Section titled “7.5 Why can I not select a group to move it?”This is probably because the objects take up all the space in the group and there is no “free” space in the group that you can click on. Because of the way layers work, smaller objects are always on top of larger objects, the objects in the group will always be selected first. The only option here is to drag one of the objects out of the group, resize the group slightly (so that there will be some free space), and then drag the object in. Below you can see an example of a group with top “free” space denoted by its lighter color compared to the space where the widgets are located.
7.6 How to sync widgets and charts
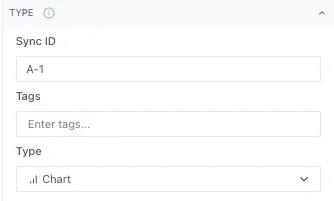
Section titled “7.6 How to sync widgets and charts”You can sync widgets within a dashboard by adding a Sync ID to the widgets you wish to sync together. The Sync ID can be letters, numbers and the special characters ”-” , ”,”, ”.” and ”- ”. You can set the Sync ID by selecting the widget in your dashboards, opening the “Type” option in the right-side menu and typing it in the “Sync ID” space. Remember that it is case sensitive, so be sure the Sync IDs are an exact match.
In this example, both charts are synced so when you hover over one of them, it shows the value of both charts. This allows you to evaluate several trends at the same time across charts.
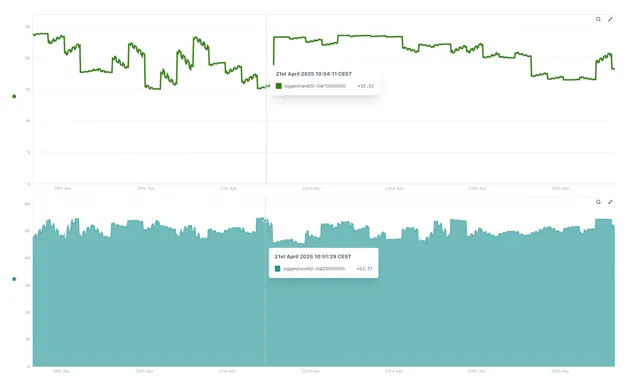
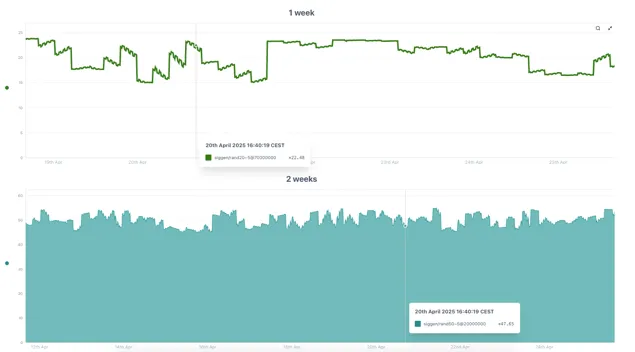
If both charts are displaying the same time span as we have in the previous example, the lines will be aligned one on top of the other. If the charts are displaying different time spans as the next charts, the lines will not be aligned but will still be synced, both displaying the data for the same date and time.
7.7 My Control component shows [object Object] rather than the list of values
Section titled “7.7 My Control component shows [object Object] rather than the list of values”Make sure the connected variable is prefixed with a dollar sign ($)
For more information please contact us at [email protected] or book a demo on our website at www.eigen.co