

Risk/RAG Matricies
What is a RAG/Risk Matrix?
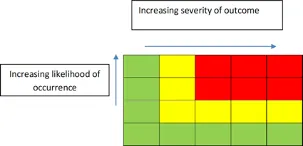
Section titled “What is a RAG/Risk Matrix?”A RAG matrix, also known as a risk matrix, is a visual tool used to assess and communicate risk by plotting two dimensions against each other, the likelihood of a hazard occurring and the consequences if it does. The resulting grid provides an at-a-glance view of the overall risk level associated with a particular hazard or barrier, combining both factors into a single risk rating.
The matrix takes its name from the traffic light colour coding used to indicate risk levels across the grid Red, Amber, and Green with higher-risk combinations (high likelihood and severe consequences) appearing in red and lower-risk combinations appearing in green.
Understanding the Axis
Section titled “Understanding the Axis”- Consequences — the horizontal or vertical axis representing the severity of the outcome if the hazard occurs. Typical categories include: Catastrophic, Critical, Moderate, Low
- Likelihood — the opposing axis representing how probable it is that the hazard will occur. Typical categories include: Likely, Probable, Occasional, Remote, Unlikely
The specific wording used for both axes will depend on your BSP configuration and the risk framework adopted by your organisation. The number of categories on each axis may also vary. The underlying principle consequences plotted against likelihood remains consistent across all configurations.
Features of the Risk Matrix?
Section titled “Features of the Risk Matrix?”Hovering for detail
Hovering over any element within the risk matrix displays additional information about that hazard, including its name, current risk rating, and any notes or context relevant to the assessment.
Clicking for deeper insight
Clicking on an icon or bubble within the matrix opens more detailed information, allowing you to drill down into the factors contributing to that hazard’s risk position. This typically includes links to relevant barrier functions, performance standards, and current impairments affecting the risk assessment.