Bubble Charts
What is a Bubble Chart?
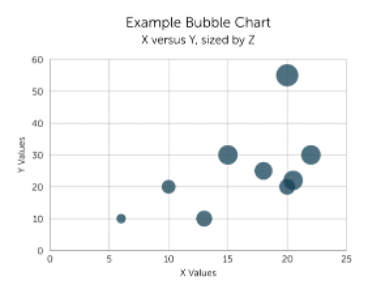
Section titled “What is a Bubble Chart?”A bubble chart (or bubble plot) is a data visualisation used to compare groups of related information. Each data point is displayed as a bubble, where:
- Position represents values along the X and Y axes
- Size represents quantity or magnitude
- Colour represents status, severity, or progression
Bubble charts help users quickly identify patterns, trends, clusters, and high-priority areas within large datasets.
Bubble charts in Eigen BSP
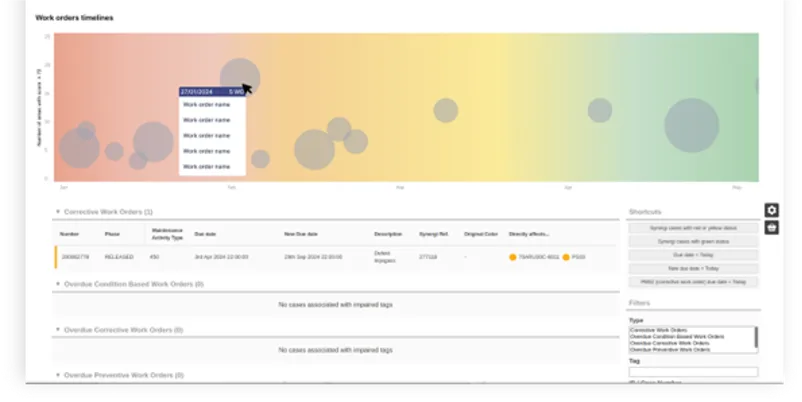
Section titled “Bubble charts in Eigen BSP”In Eigen BSP, bubble charts help offshore teams compare upcoming safety-critical work orders to better prioritize maintenance activities and reduce the risk of overdue maintenance on safety-critical equipment.
Key Features
- Bubble size represents the number of work orders or selected category value
- Bubble colour indicates risk level, priority, or progression status
- Labels identify the associated asset, category, or activity
- Right-clicking or hovering over a bubble displays additional contextual information
- Overlapping bubbles may indicate trends, clustering, or increasing work order density
In Eigen BSP, all bubbles measure the same dimension. Bubble colour does not represent a separate measurement and is used only to indicate status or severity.
Unlike fixed red, yellow, and green status stages, Eigen BSP uses a smooth colour gradient to provide a more gradual visual transition between risk levels. This helps users identify emerging risks earlier and supports smoother maintenance planning.
Types of bubble charts in Eigen BSP
Section titled “Types of bubble charts in Eigen BSP”In the Eigen BSP, the bubble chart can be represented as both a “bubble chart” and a “bubble timeline”
A “bubble timeline” measures data primarily along the X-axis, typically representing time-based progression.

A “bubble chart” measures data across both the X-axis and Y-axis, allowing users to compare multiple variables simultaneously.