

Intro to the Excel Addin
The Excel Addin refers to Eigen Ingenuity For Excel, an Excel add-in that brings industrial historian data directly into your spreadsheets.
Purpose
Section titled “Purpose”Eigen Ingenuity enables engineers, analysts, and plant operators to query, retrieve, and analyze time-series data from industrial historians without leaving Excel. Streamline data access, accelerate analysis workflows, and make data-driven decisions faster.
Where to Find it
Section titled “Where to Find it”The Eigen Ingenuity For Excel Addin can be found on the Microsoft Marketplace (as below).
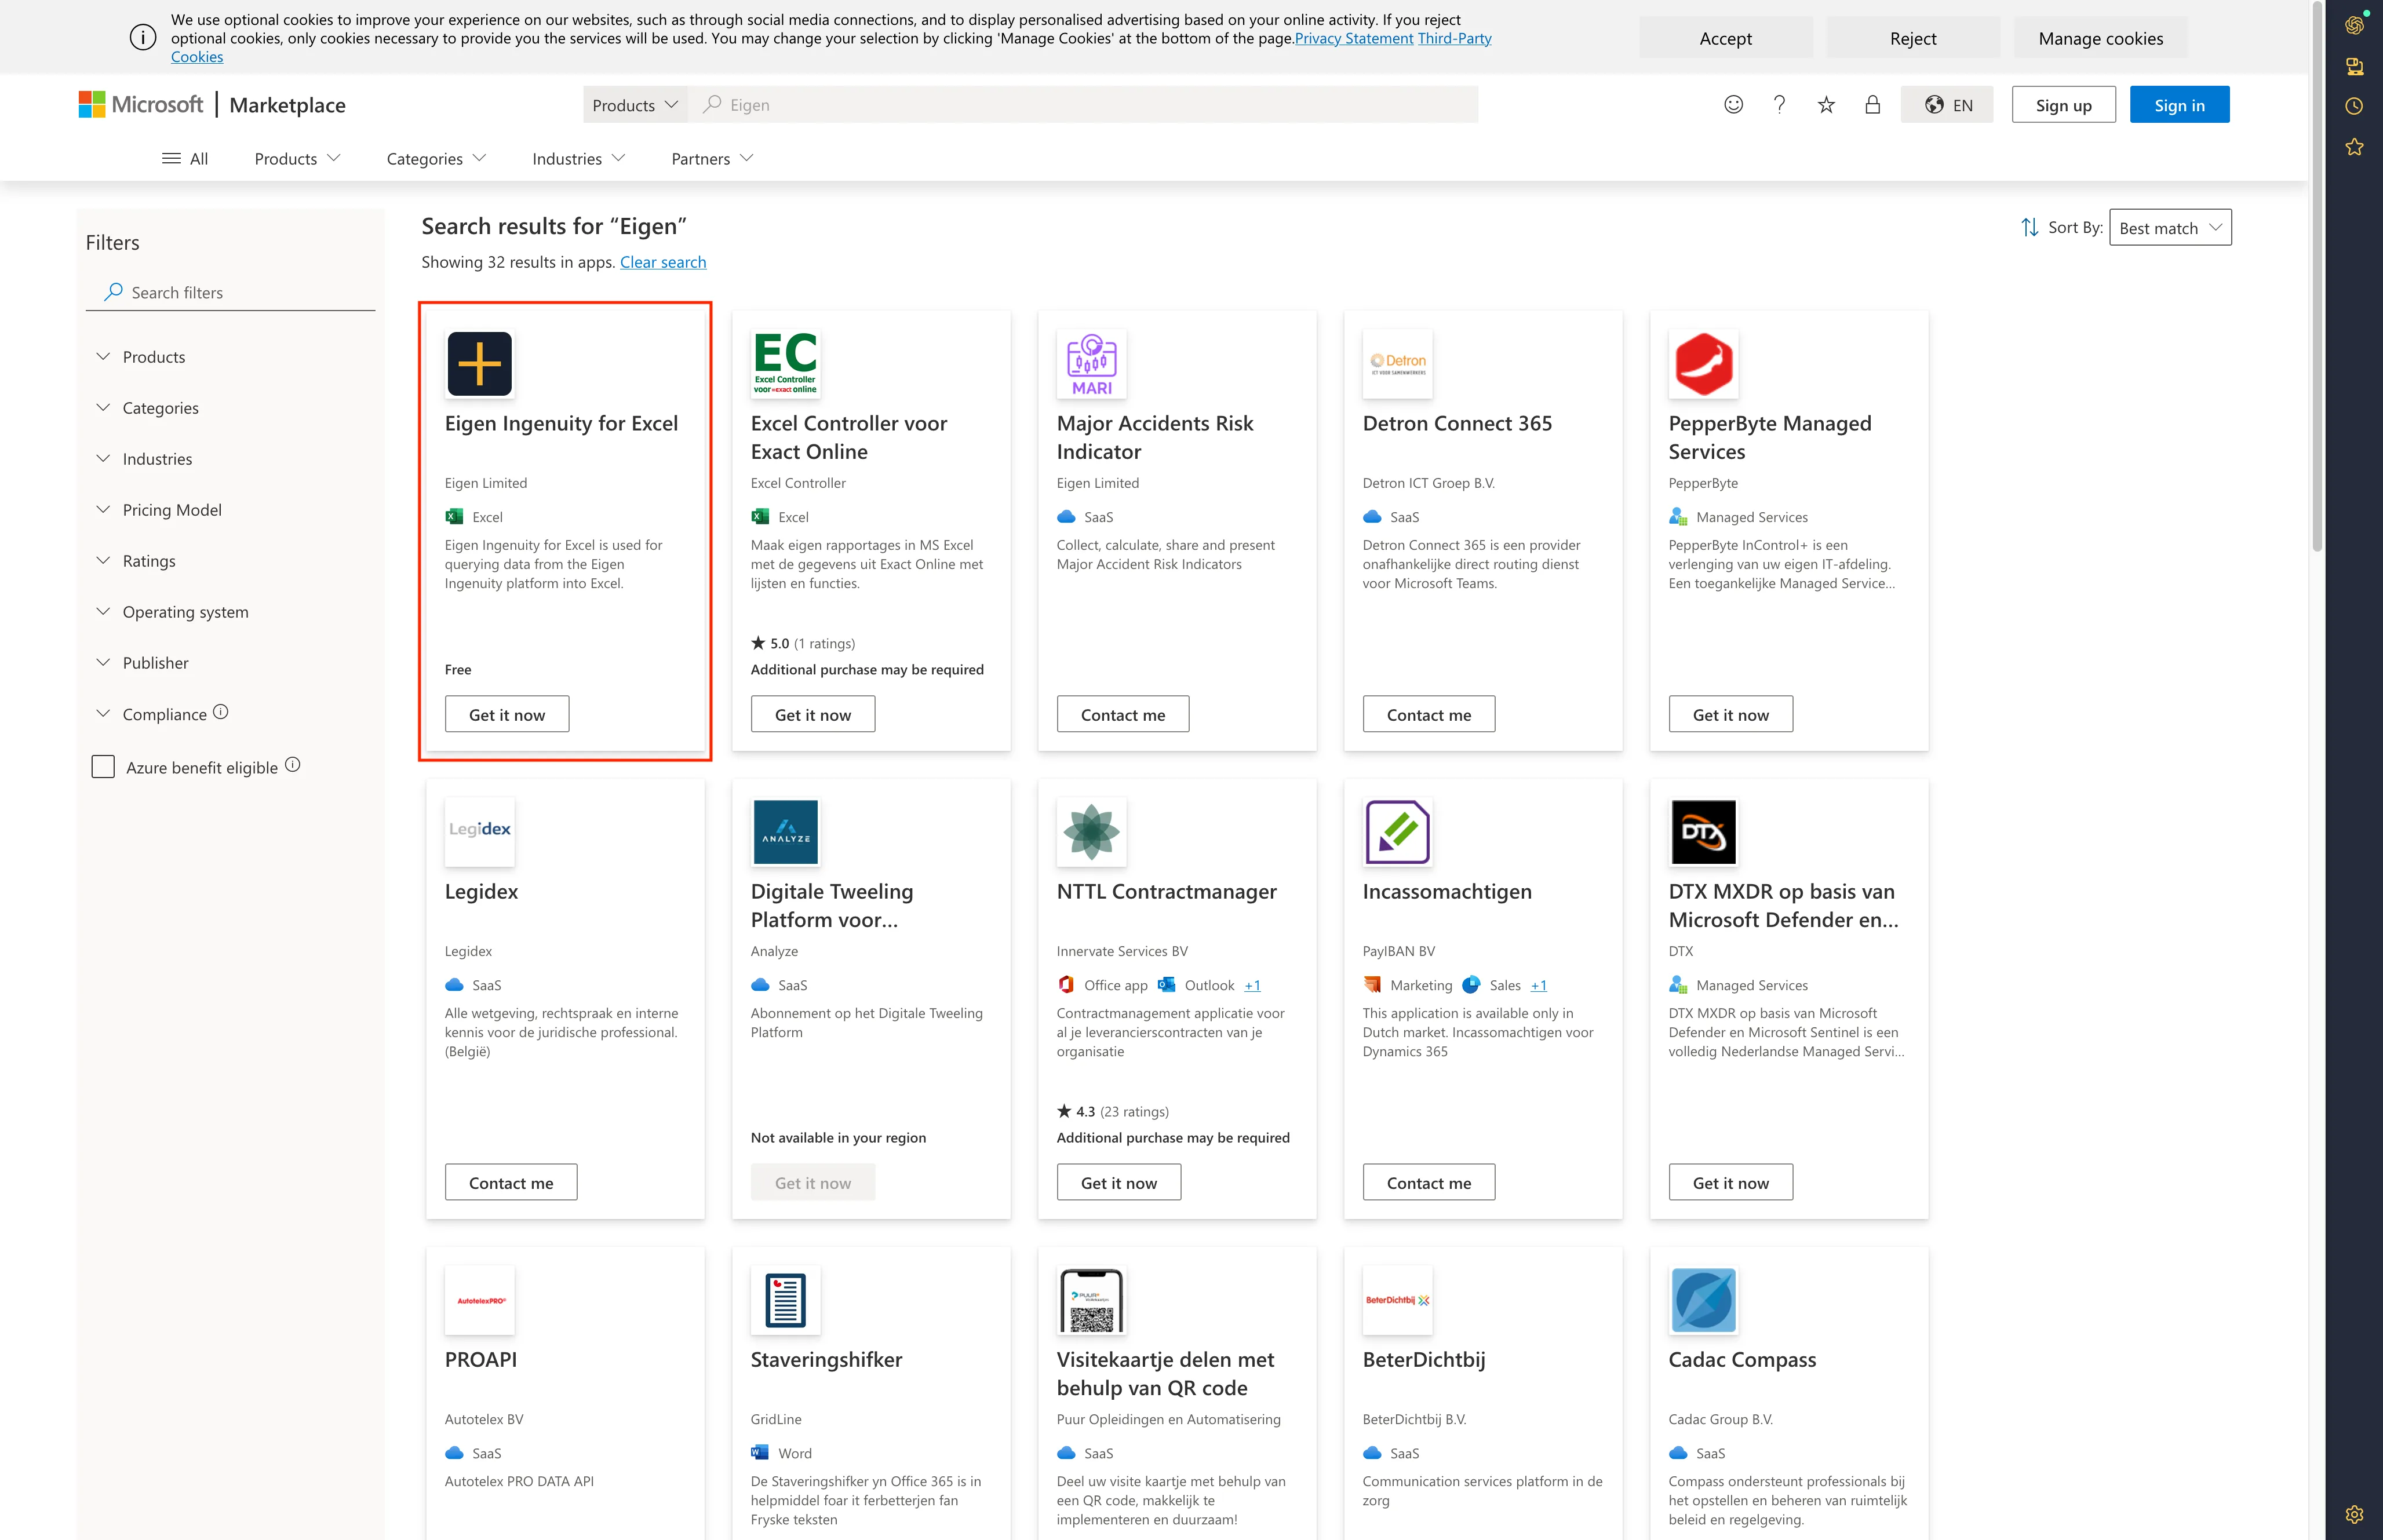
If your Organisation restricts access to the Marketplace and you would like access to the addin, you can request your Azure Administrator to allow this particular addin, or reach out to our support team at https://eigen.freshdesk.com to discuss.
Key Capabilities
Section titled “Key Capabilities”Real-Time Data Access
Section titled “Real-Time Data Access”- Current Values — Fetch the latest tag values instantly
- Historical Data — Query raw or interpolated data across any time range
- Multiple Timestamps — Retrieve values at specific points in time
Advanced Analysis
Section titled “Advanced Analysis”- Raw Data Points — Access all recorded measurements as stored
- Interpolated Values — Get calculated values at any interval
- Aggregations — Compute statistics (min, max, avg, stdDev, median, etc.)
- Time-Windowed Analysis — Calculate aggregates over sliding intervals
Data Exploration
Section titled “Data Exploration”- Tag Search — Find tags using wildcard patterns
- Metadata Lookup — View descriptions, units, and properties
- Historian Management — List and manage data sources
Flexible Output Formatting
Section titled “Flexible Output Formatting”- Tabular Views — Compare multiple tags side-by-side
- Custom Columns — Choose between tag names, timestamps, values
- Optimized Layout — Format data for easy pasting and analysis
Dynamic or Static Data
Section titled “Dynamic or Static Data”- Dynamic Data - Worksheet functions allow setting up pages that will self update and always pull the latest Data
- Static Data Writes - Option to pull data into a static table, so snapshots are preserved, and wont be lost on page refrsh, or loss of connectivity
Available Functions
Section titled “Available Functions”All functions are accessed via the EIGEN. namespace:
| Function | Purpose |
|---|---|
EIGEN.GETCURRENT() | Latest value for tag(s) |
EIGEN.GETMULTI() | Interpolated values at specific timestamps |
EIGEN.GETCLOSESTRAW() | Nearest raw point using selection method |
EIGEN.GETRANGE() | Interpolated data across a time range |
EIGEN.GETSTEP() | Evenly-spaced data points using time windows |
EIGEN.GETRAW() | All recorded points in a time range |
EIGEN.GETAGG() | Aggregated statistics (min, max, avg, etc.) |
EIGEN.GETINTERVALS() | Aggregates per time interval |
EIGEN.LIST() | Find tags by wildcard pattern |
EIGEN.LISTHISTORIANS() | Available data sources |
EIGEN.GETMETA() | Tag metadata (description, units) |
EIGEN.GETDATASOURCE() | Current default historian |
The above is all functions at time of writing, but the full list can be viewed in Excel with the Addin installed by typing (in a cell) =EIGEN. and viewing the autocompletion options.
Getting Started
Section titled “Getting Started”Basic Query
Section titled “Basic Query”=EIGEN.GETCURRENT("Demo-influxdb", "DEMO_02TI301.PV")Returns the latest value for a tag.
Search for Tags
Section titled “Search for Tags”=EIGEN.LIST("Demo-influxdb", "DEMO_02TI*")Find all tags matching a pattern.
Historical Analysis
Section titled “Historical Analysis”=EIGEN.GETRANGE("Demo-influxdb", "DEMO_02TI301.PV", "01/01/2024 00:00:00", "01/01/2024 12:00:00", 100)Retrieve 100 interpolated points over a 12-hour window.
Aggregated Statistics
Section titled “Aggregated Statistics”=EIGEN.GETAGG("Demo-influxdb", "DEMO_02TI301.PV", "01/01/2024 00:00:00", "01/01/2024 23:59:59", 1, {"avg","max","min"})Get average, maximum, and minimum values over a day.
Advanced Options
Section titled “Advanced Options”Customize output using optional parameters:
headers— Include column headers in resultsshowTag— Display tag names in outputtabular— Render in side-by-side comparison formatvalueOnly— Return only values (no timestamps or tags)
See Advanced Options for detailed examples and output samples.
Documentation
Section titled “Documentation”-
Function Reference — Detailed docs for each function with examples
-
Advanced Options — Flag combinations and output formatting
Common Use Cases
Section titled “Common Use Cases”Track Equipment Performance Over Time
Section titled “Track Equipment Performance Over Time”=EIGEN.GETSTEP("Demo-influxdb", "DEMO_02TI301.PV", "01/01/2024 00:00:00", "01/01/2024 23:59:59", "1h")Get hourly temperature readings to monitor trends.
Compare Multiple Measurements at One Point in Time
Section titled “Compare Multiple Measurements at One Point in Time”=EIGEN.GETMULTI("Demo-influxdb", {"DEMO_02TI301.PV","DEMO_02TI201.PV"}, {"01/01/2024 10:00:00"}, true, true, true)View multiple tag values side-by-side at a specific moment.
Find Anomalies with Aggregates
Section titled “Find Anomalies with Aggregates”=EIGEN.GETINTERVALS("Demo-influxdb", "DEMO_02TI301.PV", "01/01/2024 00:00:00", "01/01/2024 23:59:59", "1h", {"min","max","avg"})Compute hourly min/max/avg to identify unusual spikes or drops.
Build Dynamic Tag Discovery Workflows
Section titled “Build Dynamic Tag Discovery Workflows”=EIGEN.LIST("Demo-influxdb", "*Pump*")Automatically list all pump-related tags for batch operations.
Support
Section titled “Support”Questions, issues, or feature requests? Reach out to our support team:
📧 Support Portal: https://eigen.freshdesk.com
We’re here to help you get the most from Eigen Ingenuity!